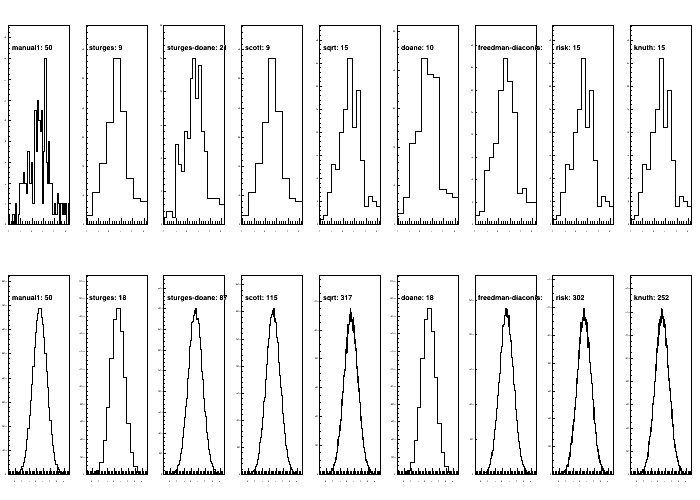
Fill histograms from arrays with automatic binning
This example demonstrates how to fill a histogram from an array of data and to automatically choose a binning with various methods.
The automatic binning requires numpy/scipy
Script output:
---------------------------------------------------------
              method                    bins   time [s]
---------------------------------------------------------
normal_small
              manual1                     50   0.28
              sturges                      9   0.00
              sturges-doane               21   0.00
              scott                        9   0.00
              sqrt                        15   0.00
              doane                       10   0.14
              freedman-diaconis           13   0.00
              risk                        15   0.01
              knuth                       15   0.01
normal
              manual1                     50   0.06
              sturges                     18   0.06
              sturges-doane               87   0.06
              scott                      115   0.06
              sqrt                       317   0.06
              doane                       18   0.06
              freedman-diaconis          149   0.07
              risk                       302   0.74
              knuth                      252   0.59
Python source code: plot_autobinning.py
print(__doc__)
from rootpy.plotting import histogram, Canvas
from rootpy.interactive import wait
import time

import ROOT
import numpy as np

ROOT.gStyle.SetOptStat(0)


class Timer(object):
    def __enter__(self):
        self.__start = time.time()

    def __exit__(self, type, value, traceback):
        self.__finish = time.time()

    def duration_in_seconds(self):
        return self.__finish - self.__start


data0 = "normal_small", np.random.normal(0.5, 1, 200)
data1 = "normal", np.random.normal(0.5, 1, 100000)
data2 = "uniform", np.random.random(100000)
data3 = "normal+uniform", np.concatenate((data1[1], 10 * data2[1]))
data4 = "normal+normal", np.concatenate((data1[1], np.random.normal(2.5, 0.1, 100000)))

if ROOT.gROOT.IsBatch():
    datas = (data0, data1)
else:
    datas = (data0, data1, data2, data3, data4)

recipes = (
    "manual1", "sturges", "sturges-doane", "scott", "sqrt",
    "doane", "freedman-diaconis", "risk", "knuth")
objs = []
canvas = Canvas()
canvas.Divide(len(recipes), len(datas), 1E-3, 1E-3)
print('-' * 57)
print('\t\t{0:<20s}{1:>10s}   {2:<6s}'.format('method', 'bins', 'time [s]'))
print('-' * 57)
for id, (dataname, d) in enumerate(datas):
    print(dataname)
    for ir, r in enumerate(recipes):
        canvas.cd(id * len(recipes) + ir + 1)
        timer = Timer()
        if r == "manual1":
            with timer:
                bins, h = histogram(d, 50, np.min(d), np.max(d),
                                    drawstyle='hist')
        else:
            with timer:
                bins, h = histogram(d, binning=r, drawstyle='hist')
        print('\t\t{0:<20s}{1:>10d}   {2:<6.2f}'.format(
            r, h.GetNbinsX(), timer.duration_in_seconds()))
        h.Draw()
        h.GetYaxis().SetRangeUser(0, h.GetMaximum() * 1.2)
        l = ROOT.TLatex(0.15, 0.8, "{0}: {1:d}".format(r, h.GetNbinsX()))
        l.SetNDC()
        l.SetTextSize(0.1)
        l.Draw()
        canvas.Update()

wait()
Total running time of the example: 2.35 seconds